2014 1st Quarter Commentary
Catching Market Highs
Cushioning Market Lows
Which is better, to catch the market highs, or to cushion the market lows? In order to answer the question above, it is important to take a historical look at different types of portfolios over volatile periods of time. For most of us, the period from 1999 through 2013 was the most volatile timeframe for financial markets we have seen in our lifetimes. In this commentary, we take a look at three different portfolios. An investment that is 100% in the S&P 500, an investment that is 100% in the Barclays US Aggregate Bond Index, and a Balanced Benchmark Portfolio which contains bonds and stocks. In the bar graph below, we will look at the performance of each asset class in the most volatile periods of the markets since 1999.
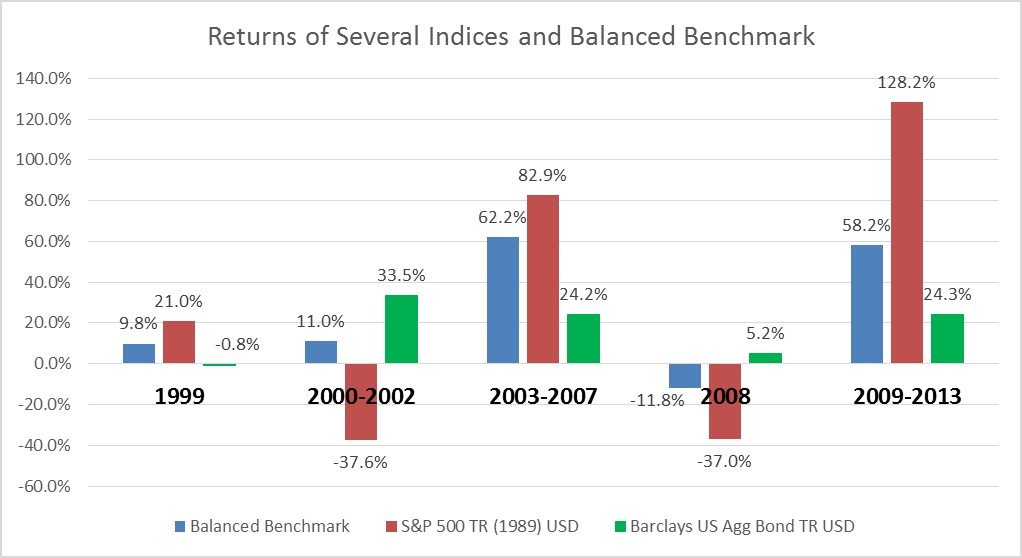
As you will notice, although the Balanced Benchmark did participate in the stock rallies of 2003-2007 and 2009-2013, it never was the best performing portfolio.
The next graph charts the growth of $100,000 in each of the portfolios from January of 1999 to December of 2013.

Please note that the Balanced Benchmark portfolio outperformed the other two portfolios over the time period. This happened even though the Balanced Benchmark was never the best performing portfolio in any of the time periods shown on the previous graph. The reason it was able to outperform was because, while it did participate in stocks, it was also built to cushion the portfolio during downturns.
This does not mean that at Financial Professionals Incorporated we put everyone into a Balanced Benchmark Portfolio. Obviously we are guided by each investors own unique circumstances and risk preference. However, it does mean that every portfolio we put together has an eye to cushioning the down markets. Let’s take a look at an investment example. If you have $100,000 in a portfolio and the portfolio drops by 50% to $50,000, that $50,000 has to grow 100% to get back to even. As the graphs show, we don’t need to make as much in the up markets if we can reduce the impact of the down markets. We realize that historical performance does not guarantee future returns, however we can certainly learn from previous markets. In our illustration, the owner of the Balanced Benchmark portfolio never got to brag that his portfolio was the highest performing portfolio, but he did end up with more money in the long run.
The views expressed are not necessarily the opinion of Cambridge Investment Research, and should not be construed directly or indirectly, as an offer to buy or sell any securities mentioned herein. Investing is subject to risks including loss of principal invested. No strategy can assure a profit nor protect against loss. Past performance is no guarantee of future results. Data for this information gathered from Morningstar. The following indices comprise the Balanced Benchmark: 58% Barclays US Agg Bond TR USD, 20% S&P 500 TR (1989) USD, 4% Russell 2000 TR USD, 8% MSCI EAFE Equal Weighted GR USD, 8% MSCI Emerging Markets, 2% Cash. Indexes are unmanaged and investors are not able to invest directly into any index
This material contains forward looking statements and projections. There are no guarantees that these results will be achieved.